Figure 1
POPULATION TRENDS OVER THE LAST CENTURY
(Back to Chapter 5 Index)
This section is based on analysis of the Census Returns beginning in 1881 and concluding with the 1991 Census. The advantage of comparing these statistics as compared with our Parish Appraisal is that they represent figures based on a 100% return.
Figure 1
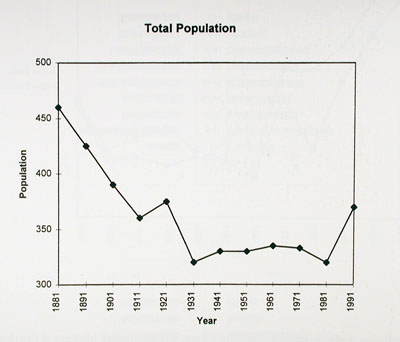
As shown in Figure 1 above, the population of Sulgrave steadily declined through the latter part of the last century and the first three decades of the twentieth century. For fifty years it remained quite static at around 320. However, the last decade has seen a significant increase to its present (1991) level of 370.
The decline, which straddled the turn of the century, was the result of classic rural-urban migration as mechanisation forced the rural resident out of agriculture. The rural worker was faced with either commuting to urban employment or moving into urban areas to find employment. As transport was particularly poor from Sulgrave the latter more often than not took place.
However, the last decade has seen great improvements in the road and rail links to London and Birmingham that has led to an influx of commuter based households. The increased accessibility has also made Sulgrave more attractive to retired couples. The results of attracting such people with their higher than typical disposable incomes have been an increase in population, an increase in house prices and renovating of much loved property that was in poor or dilapidated condition.
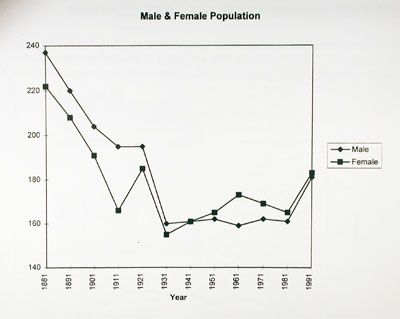
Figure 2
Figure 2 shows male/female population totals. Of particular interest is the dramatic fall in the female/male balance in 1911 and the reversal of the sex ratio between 1941 and 1951 and the significant change in 1961. However, by 1991 a fairly harmonious balance had once again been achieved!
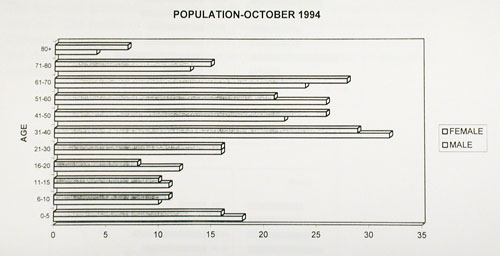
Population Pyramids
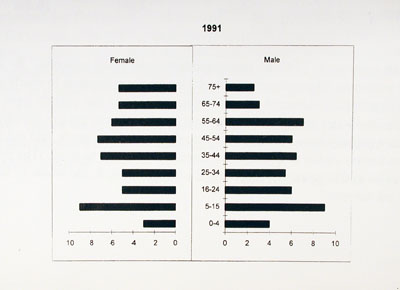
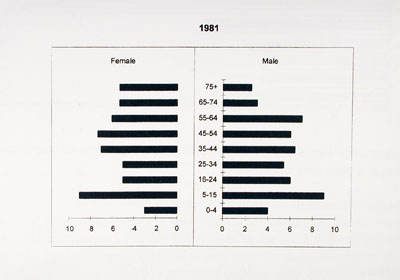

The population shows some interesting variations since 1961. In 1961 25% of the population was under 16, whereas in 1981 and 1991 this was 19%. This can be simply explained by the post war population boom, most notably in the early sixties. The 16-24 age group is significantly larger in 1981 as this bulge works its way up. By 1991 this age group represents just 8% of the population as opposed to 14% in 1981. This, allied to the fact that the next age group 25-34 in 1991 was only 10% shows how young people who were born in Sulgrave or came as children when their parents moved to the village, have had to move away to find jobs and houses.
The immediate locale can no longer provide the right type of employment nor housing at a price they can afford.
The biggest increase by far since 1961 has been in pensioners:
| 1961 | 1981 | 1991 | |
|---|---|---|---|
| Pensioners | 16.5% |
18.2% |
24.0% |
| Children | 25.6% |
18.8% |
19.4% |
It can be seen that in 1981 the largest group was the 55-64 year olds. By 1991 this group were all now pensioners, thus pushing up the proportion to nearly a quarter of the population. However, the percentage of children has slightly risen by 1991 and the 25-44 age group even more significantly. These are the socially mobile people, who have been attracted by the rural charms of Sulgrave, and can afford to buy properties within the village and commute regularly to work. The proportion of females in this group are singularly the largest group in the whole of Sulgrave - don't ask me why!